Infections & testing data
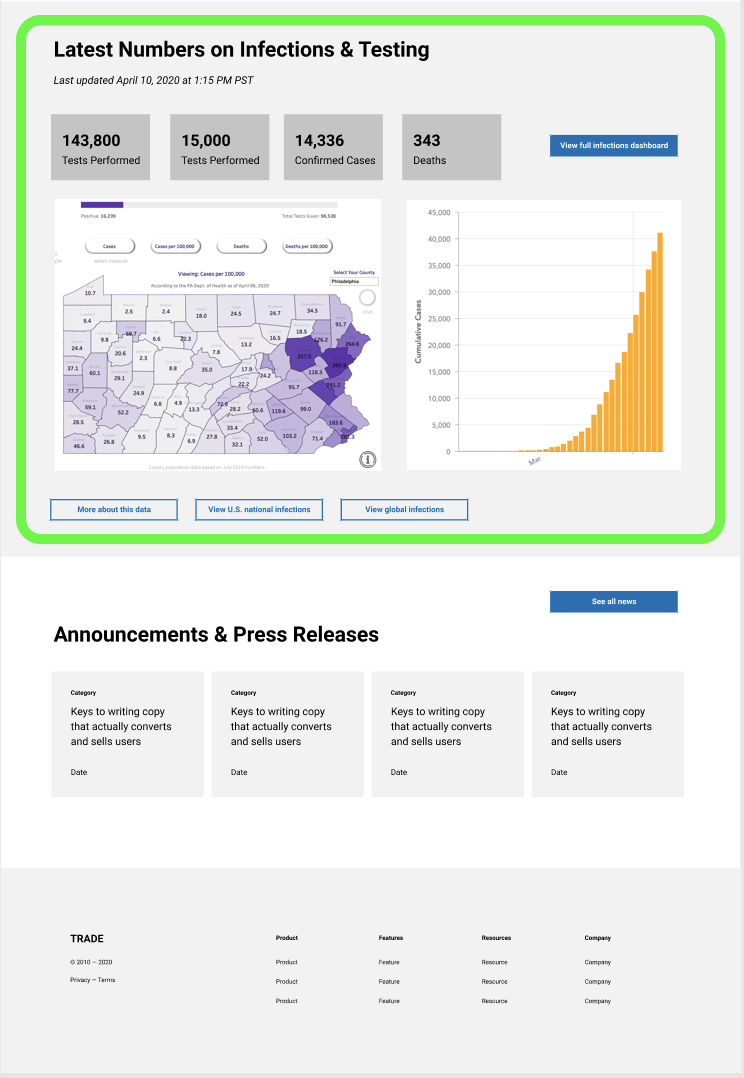
If your state or locality has data on testing, infections, and locations with outbreaks, surface this information on your website in a clear, easy-to-read, and visual manner. Ideally, you have some interactive graphs or visualizations that users can browse. For national and global data, there are many data resources that don’t require you to maintain that data yourself, so you can link to those. We recommend:
Tableau COVID-19 Viz Gallery: A curation of the those impactful data visualizations about Coronavirus (COVID-19) - from Tableau, an enterprise tech company that maintains its data and info really well
Coronavirus Global Cases Map: **Interactive world map of COVID-19 cases from Johns Hopkins

For data specific to your state/locality that you have on your website, you may want to include:
How many tests have been performed
How many test results are pending
How many test results are confirmed positive
How many test results are confirmed negative
Number of deaths
Number of recoveries
When the data was last updated (example:
Last updated on April 4, 2020 at 4:00pm PST)We also recommend including a link to a page that has information about the data source, how it was collected, and its accuracy. As an example, “latest numbers” section of the State of California’s website links to this page, which has the data sources and descriptions.
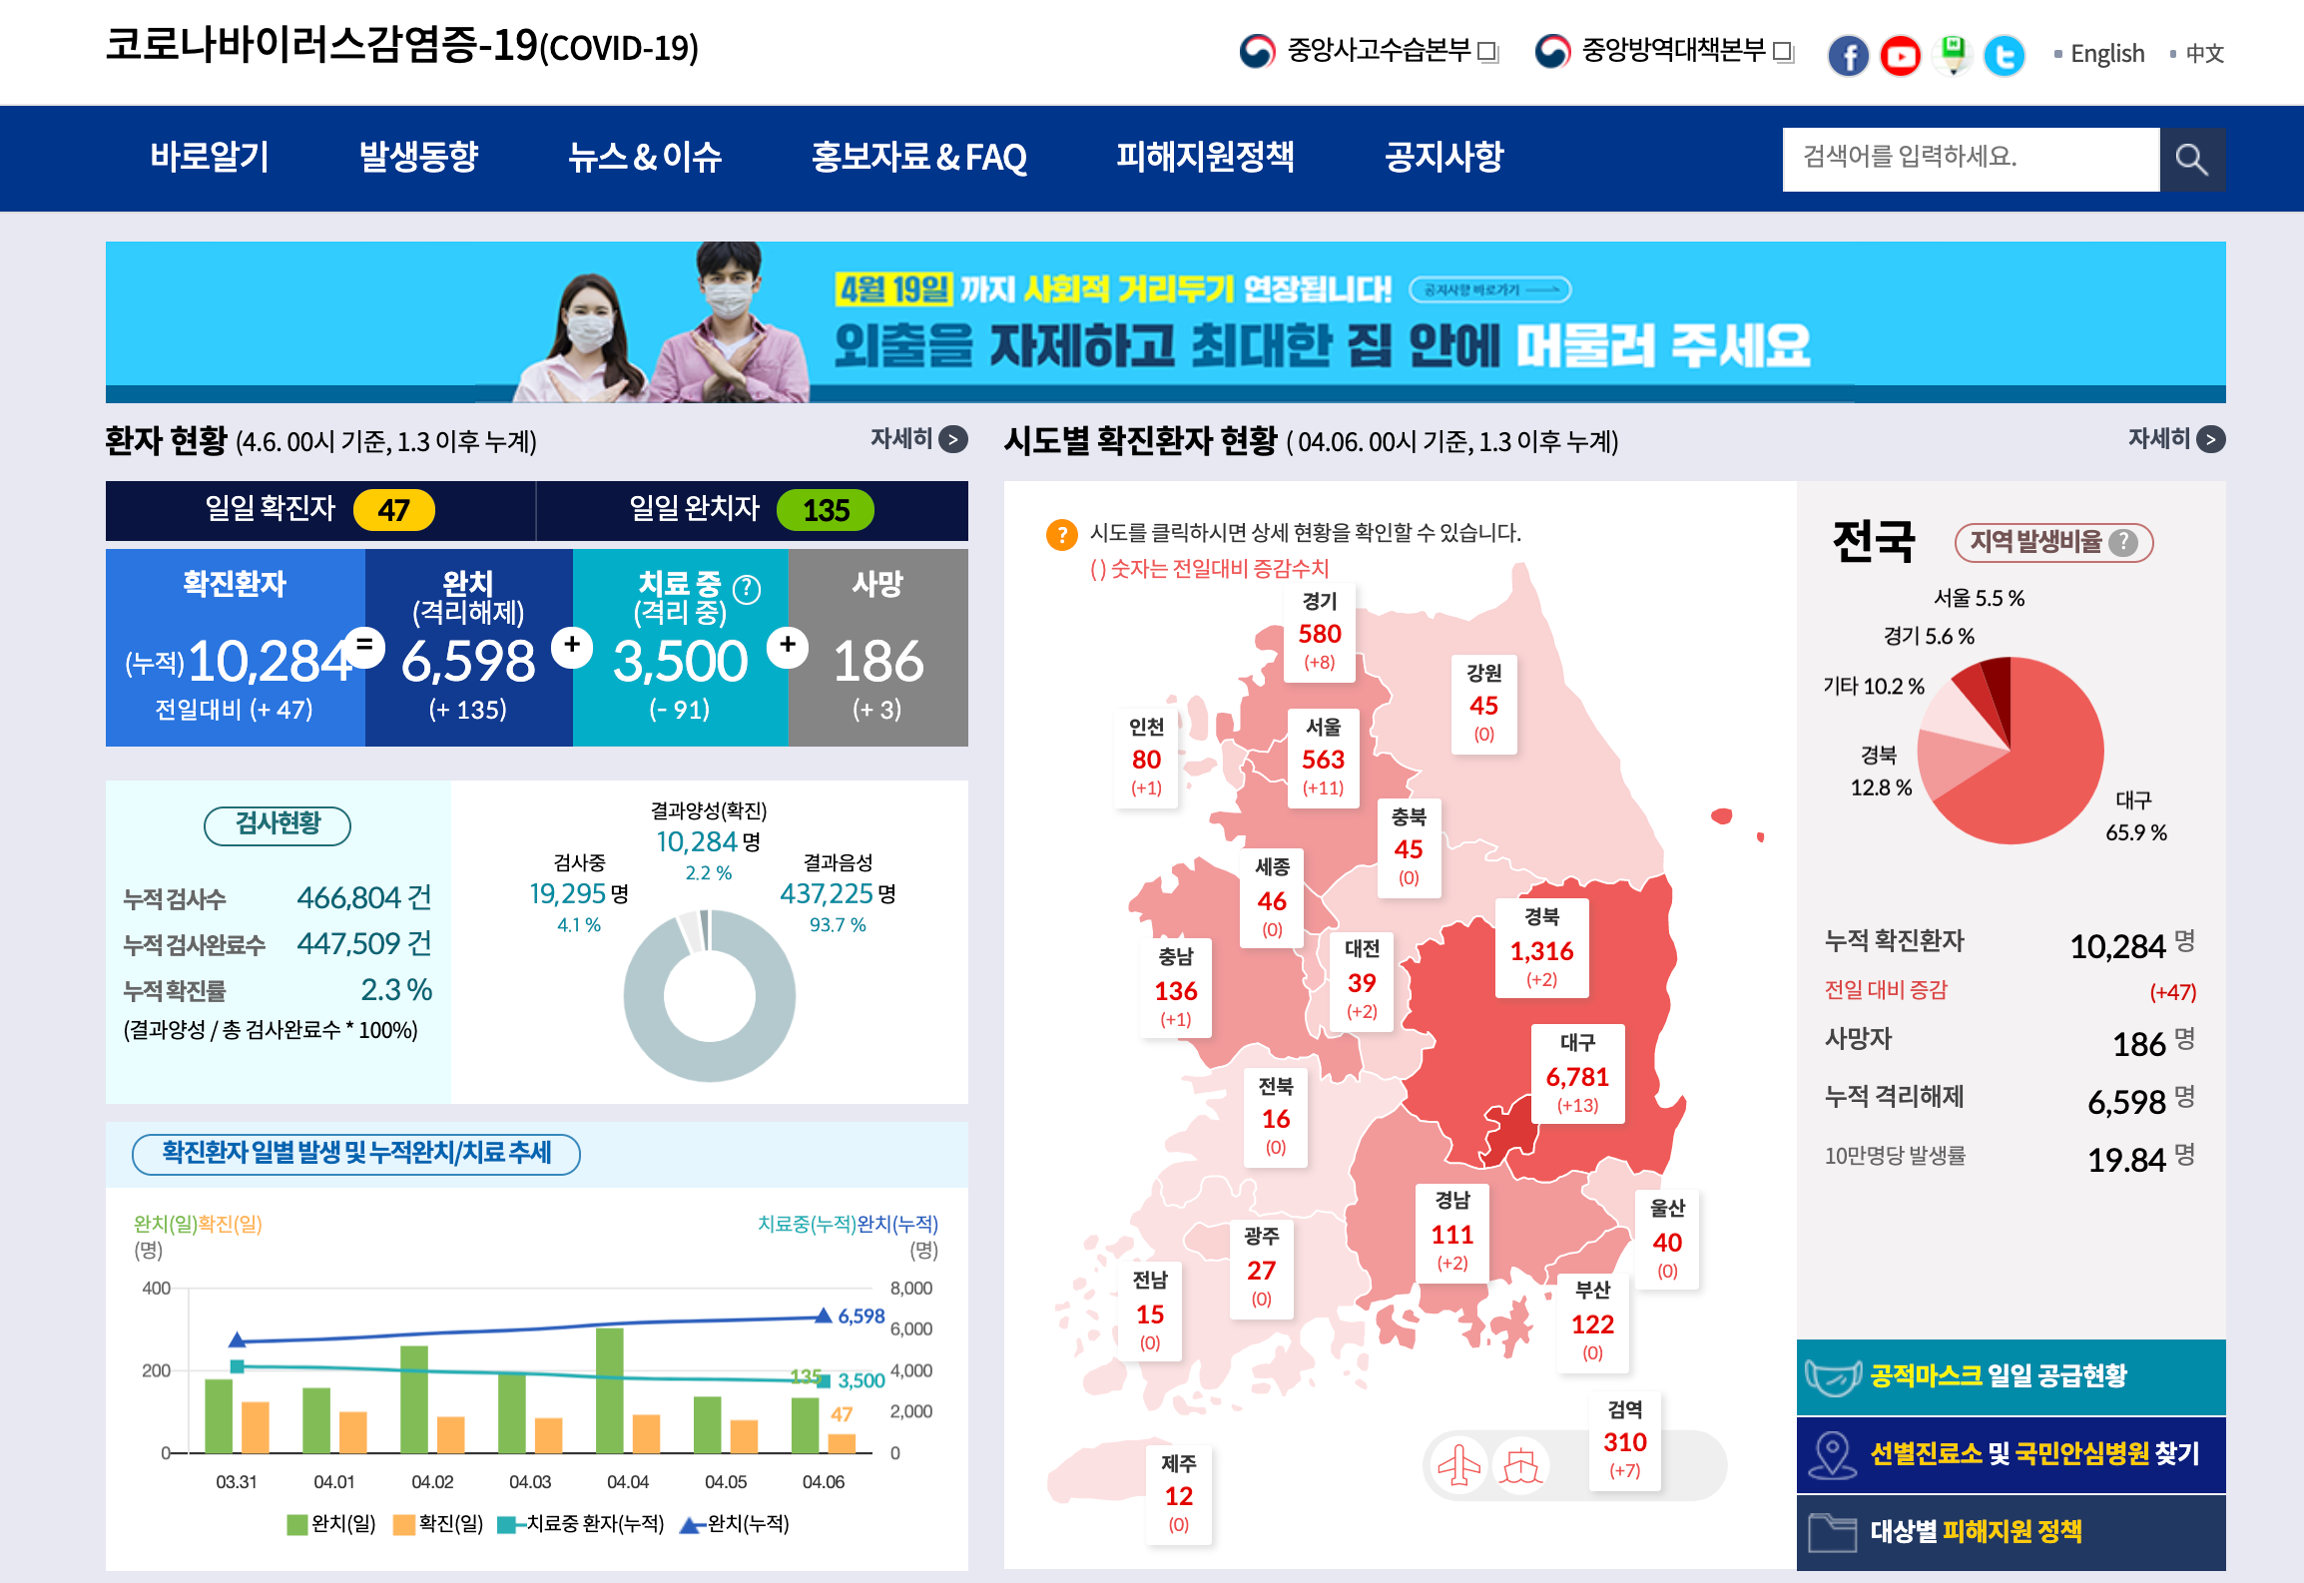
A great example of a government with clear, easy-to-read data about COVID-19 testing and infections is the South Korean national government’s site.

Last updated
Was this helpful?